Forex Strategy Simulations
INTRADAY PRICE ACTION STRATEGY SIMULATIONS: AUD/USD Trade Example 1
Based on actual trading data from Jan 03, 2014. Using the Intraday Price Action Strategy on a minor currency pair, we enter a long-term trade on an intraday basis. The Price Action Strategy signal, position of support and resistance, multiple time frame analysis, trend lines, and profit targets are considered before entry. The trade is given a wide ultimate profit target with three partial exits, and remains open for several days.
AUD/USD Trade Example 1
Subjects Covered:
- Intraday Trading
- Signal Candles
- Position of Support/Resistance
- Quality of Support/Resistance
- Multiple Time Frames Analysis
- Round Numbers
- Weekend
- Channels
- Trade Management
Signal 1
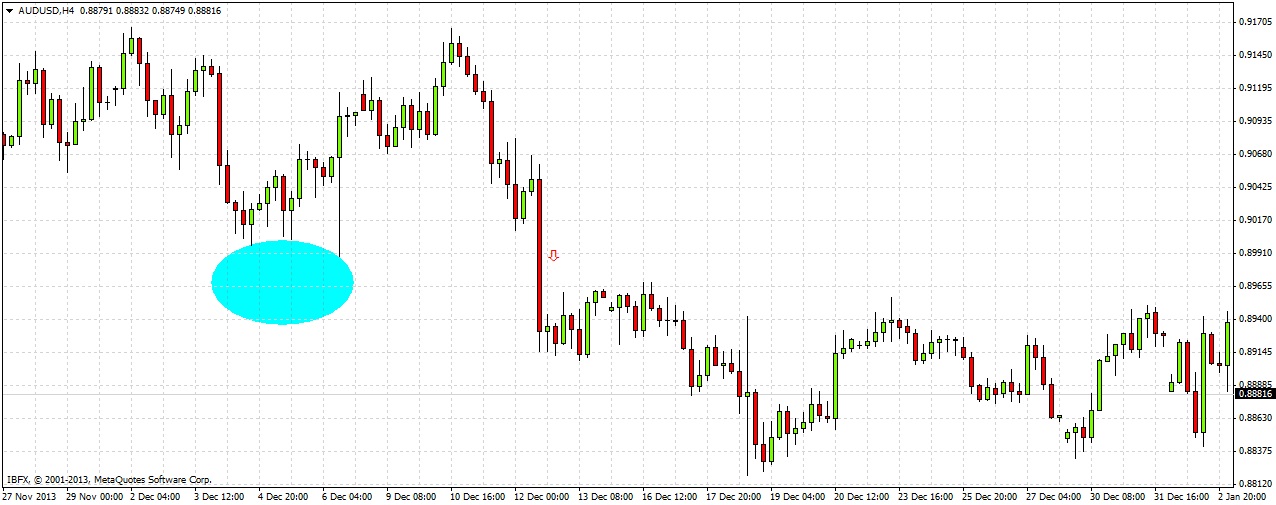
An examination of the last month’s price action shows that an interesting potential S/R level is being approached. The level is visible on this 4 hour chart as having acted as strong, bouncy support several times during early December 2013, on 3 consecutive days. A few days later, the level was broken strongly to the down side, and has not been touched since. It deserves a closer look.

Signal 2
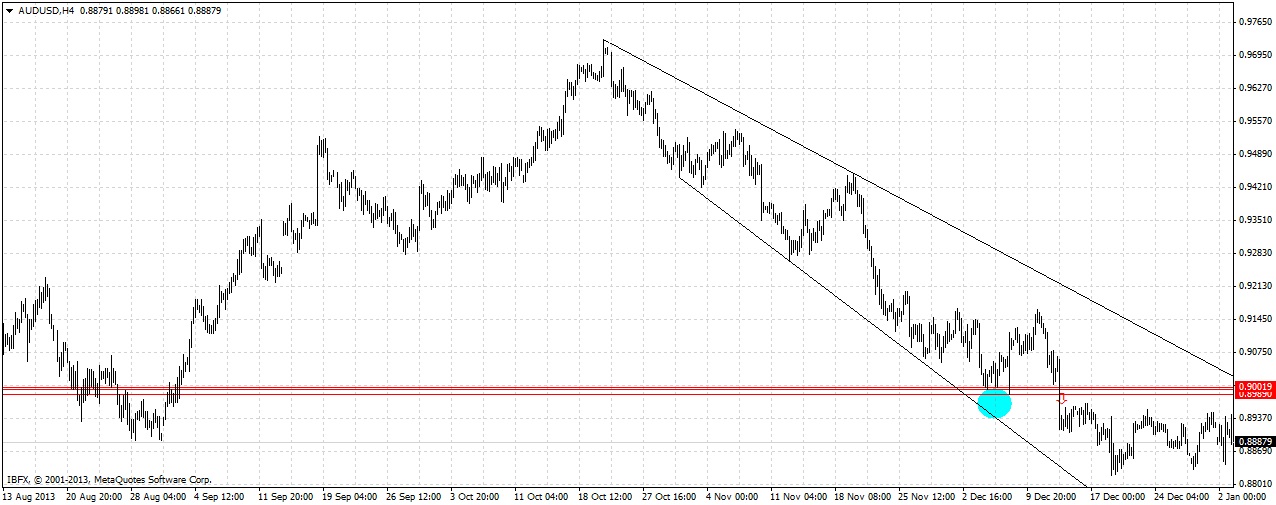
Zooming in to the chart shows that the three consecutive daily lows at the support zone printed at 0.8998, 0.9002, and 0.8989 respectively. Clearly, the support was confluent with a psychologically key round number: 0.9000. So far, it looks like it should be a high-probability level at which to look for a short trade. Let's take a look at the long-term picture next.
Signal 3
This pair has been in a long-term downwards trend since April 2013, so we know that if we enter a short trade, we will be trading in sync with the long-term trend. Looking at the chart over the last few months, the pair has been trading within a downwards channel. The level of 0.9000 is approaching the upper trend line. So we have confluence of a key round number, a channel trend line, and major S/R level at 0.9000.

Stop & Think
We need to consider whether to simply enter a short limit order at 0.9000, or wait to see the price action when the level is reached. The advantage of entering right away with a limit order is that it usually gives you a better price than waiting for a candlestick confirmation. The disadvantages are that entering without confirmation is more risky, and also that it is hard to know where to place the stop loss. A stop loss based upon the depth of the S/R zone or current volatility may be used. We decide to wait for candlestick confirmation before entering, as the Asian session’s upwards move has been very strong, and we do not want to risk trying to “catch a falling knife”.

Multiple Time Frames Analysis - Part 1
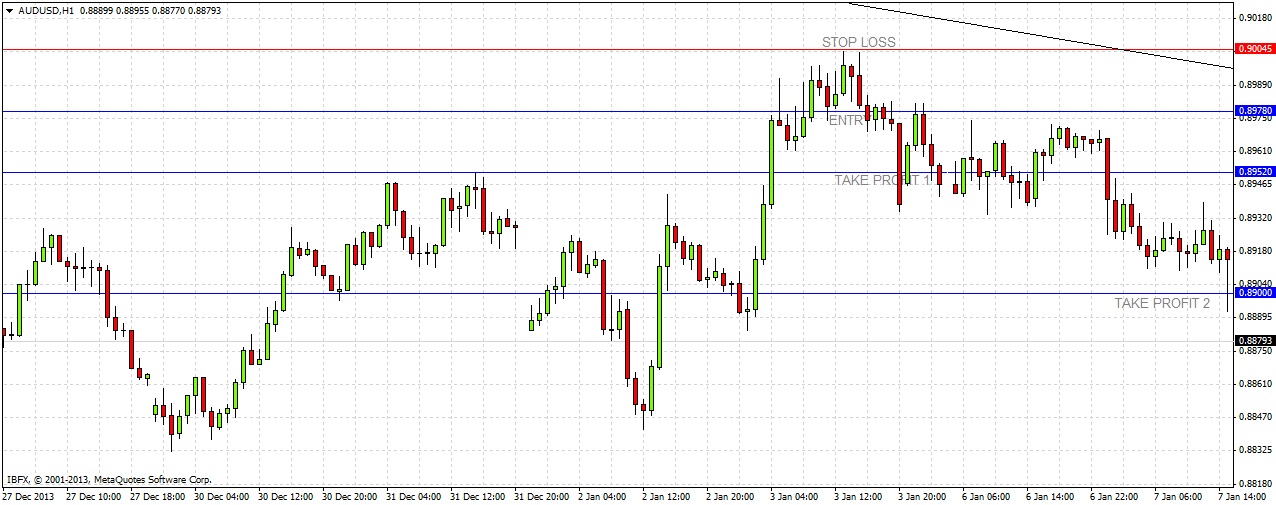
After waiting all day for confirmation the price finally hits 0.9000 and subsequently prints a bearish outside bar closing near its low on the 1 hour chart. The candle is a bearish sign, as is the fact that the price tried twice to break past 0.9000, but could barely manage to get above it by 3 pips. We must look at the 4 hour chart next.

Multiple Time Frames Analysis - Part 2
The 4 hour chart shows a simultaneous bearish pin bar. When two different next level time frames are simultaneously indicating the same thing, this is a good sign. We decide to enter 1 pip below the low of both the candles. Note that the entry comes very close to the weekend, which is uncomfortable and somewhat risky. We can lose more than our stop loss by leaving a position open over the weekend, especially a new position showing little or no profit. However, the argument can be made that there is also a reward for taking on this extra risk, as historical data shows that weekend gaps tend to occur in the direction of the trend.

Entry
Our sell stop order at 0.8978 is triggered very quickly. Our stop loss is at 0.9004, 1 pip beyond the daily high. We decide we will take the risk off the trade before the weekend close if possible by taking half of the position as profit at a reward to risk of 1:1. We will take half of the remaining profit at 0.8900, which is a logical support level, and leave the remainder of the position to run.

Exit 1
Fortunately we are able to take the risk off the trade less than an hour before the market closes for the weekend. Our trade is now 0.5 units of risk in profit.
Exit 2
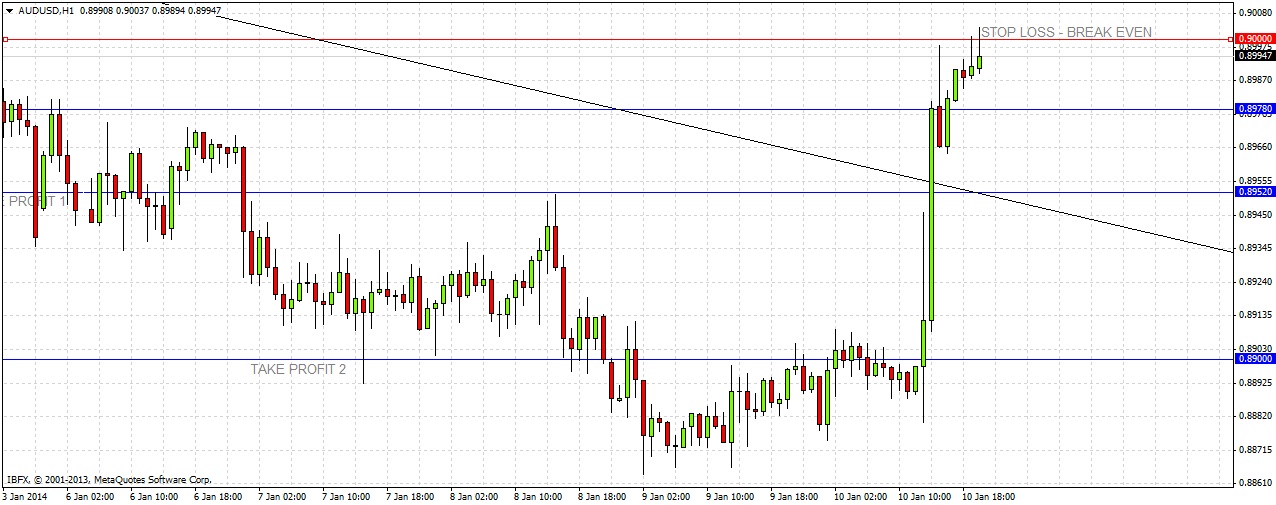
We have to wait until shortly after the New York session opens the following Tuesday, after the weekend, for our second profit target of 0.8900 to be hit. We take half of the remaining position as profit, which is a quarter of our original position, giving us an extra 0.75 units of risk as profit. We have a total 1.25 units of risk as profit whatever happens next. We decide to wait a few more days and see what happens with the trade before determining any new profit targets for the remainder of the position.
Final Exit
The poor US economic data causes the USD to weaken against the AUD and within 2 hours of the news release, our break-even stop loss at 0.8978 is hit.
We have a final profit on this trade of 1.25 units of risk.
It would have been better to take more profit shortly before the US non-farm payroll data was released, but if the numbers had been good, it would have been better to take the action that we did.
U.S. Economic Data: Non-Farm Payrolls
This important economic data release is unexpectedly poor for the U.S. economy, and the market reacts instantly by selling the USD.
