PICKING PAIRS & STRATEGIES: Market Snapshot Example 2

Market Snapshot Example 2
Subjects Covered:
- Multiple Time Frame Coordination
- Signal Candles
- Time of Day
- Position of Support/Resistance
- News Impact

Weekend Review 1
Trading sounds so easy when just talking about it, but it can be so difficult when doing it in the market with real money. It might be hard to carry on even when you are running a profitable position and your system is telling you not to stop. Similarly, sitting on positions and watching the counter-rallies cost you lots of money is not easy.

Weekend Review 2
The source of this pain is simply not knowing what will happen in the future, and of course the fear of losing. That is why I believe the outcome of the trades we make also depends on psychological aspects. In order to minimize such effects, we have to study the charts. This week, we have 4 pairs to analyze and to decide what to do (or what not to do).

Weekly News Calendar
Here is what I did on the chart after a short observation. The next thing I do is to check the weekly economic calendar and find out if there are any high impact report releases which might affect the pairs I picked.

USD/CAD
Now let’s inspect the charts closely:
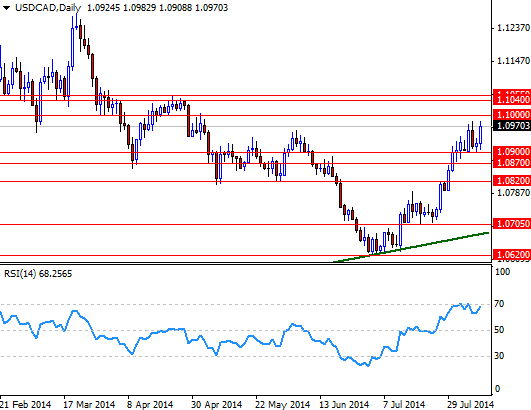
This pair traveled a good amount of distance since the market formed a bottom around the ascending trend-line originating from 2012 and reversed (or more accurately, returned to its main course). It seems like the pair is overbought at the momen,t and there are some tough resistances ahead. However, if the bulls push prices above the 1.1055 level, there won't be much to slow them down
Options:
- Open a short position…It can't rise forever!
- Open a long position if prices reach pull back to the 1.0820 level.
- Keep an eye on the 1.1000 - 1.0900 area and wait for a breakout.

EUR/AUD
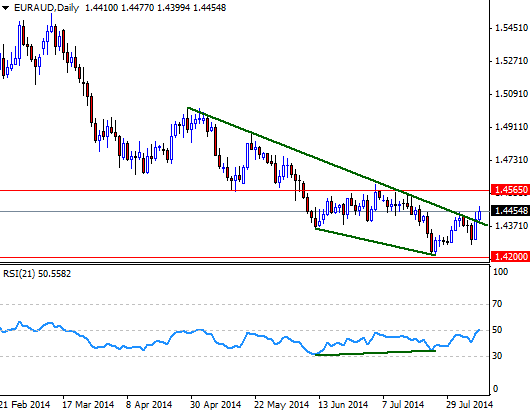
It appears that the RSI has been warning investors about a change in the wind direction. As you can see on the chart, there is a visible difference between price and the RSI (divergence). These types of irregularities shouldn't be used (alone) as trading signals, so look for other supportive signs: breaking above a descending trend-line, for instance.
Options:
- Go long targeting the 1.0465 level.
- Open a short position if the pair hits the 1.4565 level
- Wait for a break out (go long on a sustained break above 1.4565 targeting somewhere near 1.4860, go short if the pair closes below 1.4200).
EUR/USD
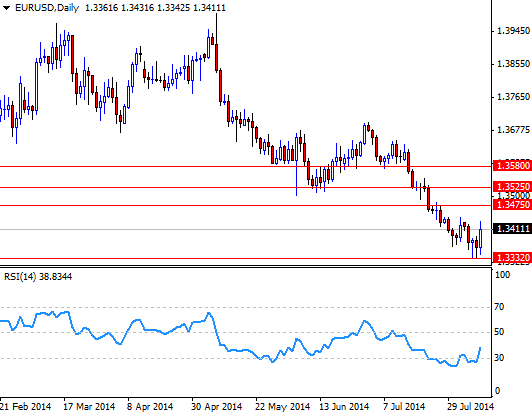
The EUR/USD pair has been sinking steadily since it hit the 1.40 level. The Euro is still under the pressure due to weak economic data. In the meantime, the demand for the American dollar is increasing. However, the pair managed to find support just above the 1.3330 level and erased some of its losses.
Options:
- Hey I see a similar divergence (RSI - Prices)! Go long targeting 1.3475 and 1.3525.
- Sell at 1.3475 or buy around 1.3332.
- Buy above 1.3475 or sell below 1.3332.
GBP/USD
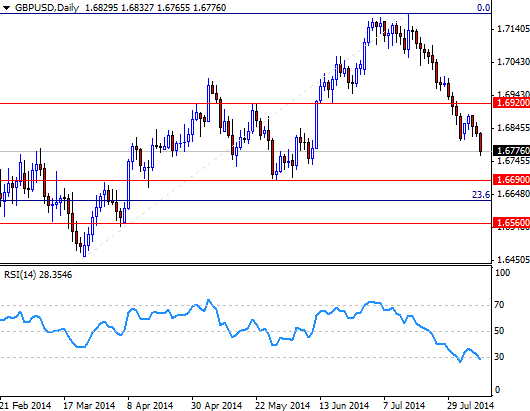
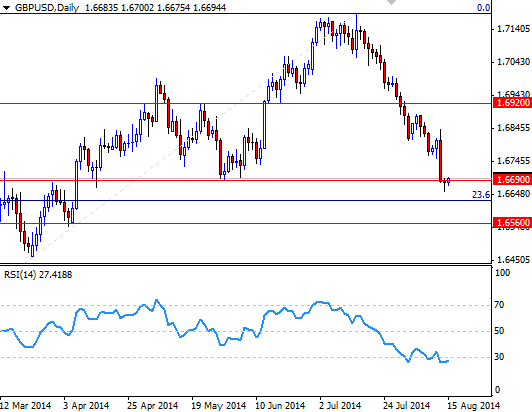
For the fifth week in a row, the GBP/USD pair closed lower than it opened. Although this type of reaction is not surprising (the market has been pricing in rate hike expectations for a long time and now people are realizing that the Bank of England may wait until the winter), falling almost without a break makes me suspicious. Selling the rallies might be better than buying the dips. If the market can't anchor somewhere above 1.6920, then it is likely that the pair will continue to retreat towards the 23.6% Fibonacci retracement level of a recent major move.
Options:
- Go short targeting 1.6690 and 1.6640…nothing can stop the greenback!
- Go long with a stop below 1.6690...this pair is oversold!
- Go long above 1.6920...the uptrend is not over!

Now Plan Your Trade
Now check the charts again -add your own trend-lines, s/r levels and indicators- and plan your trade(s)…Keep in mind that you can create your own trading conditions/scenarios, your options are not limited.

Past Week Review
Last week, we picked 4 new currency pairs and applied some technical analysis methods to decide what to do (deciding what not to do is as important as what to do, if you want to be a successful trader). Today, we are going to see the results.
USD/CAD 2
This pair had been bullish since it bounced off of the ascending trend-line originating in 2012. However, the pair was overbought and struggled to break through the 1.1000 resistance level. Because of that, we had thought that the market didn't have much room to go up unless the bulls captured the 1.1055 resistance level. Now let’s look at what happened next:

USD/CAD 3
The USD/CAD pair encountered selling pressure and ended the week lower than opening. It looks like opening a short position after breaking below the 1.0900 support was not a bad idea.
EUR/AUD 2
The EUR/AUD pair had broken above the descending trend-line which the market has been respecting for three months. Although this was technically bullish, we needed more signs for a long confirmation. Now let’s check what happened:

EUR/AUD 3
The EUR/AUD ended the week lower than it opened, but Friday's price action makes me wonder if the market is really getting ready for a take off. This pair didn't provide any real trading opportunity for us because the key levels we have been watching were too far away.

EUR/USD 2
Last week, we had said that the EUR/USD has been under the pressure since it touched the 1.40 level. Gloomy economic data and fear of deflation were working against the Euro. On the other hand, we had noticed that the RSI was giving a warning (indicator-price divergence). Did this pair end the week higher?

EUR/USD 3
No, the market ended slightly down on the week. However, the 1.3300 level continued to offer support - even after highly disappointing economic data out of the Eurozone. It appears that going long around the 1.3320 support level was the best option.
If the market is ignoring a series of better (or worse) than expected data, you should be cautious in trading in line with that data.

GBP/USD 2
The GBP/USD pair has been falling steadily - almost without a break. Failing to hold above the 1.6920 level had changed the outlook to negativ,e and because of that we had mentioned that heading towards the 23.6 Fibonacci was likely now, unless the market anchored somewhere above 1.6920. Did this pair end the week lower?
GBP/USD 3
The pair initially tried to climb, but eventually continued its downwards course and approached the 23.6 Fibonacci retracement level. It looks like going short targeting 1.6690 and 1.6640 was our best option.
