Now you understand some basics about candle charts , you are ready to get to the heart of Technical Analysis and learn the tools required to identify the likely S/R areas at which to enter or open a position and the likely S/R zone at which to best exit or close it.
The first lesson in this course reviews price levels and areas where trends tend to start, pause, or reverse. We will show you how price levels are really narrow price bands or ranges, rather than specific prices, and how to find these on the charts. We will then discuss single trend lines and review up, down, and flat single trend lines.
You will then learn about channels, which are parallel trend lines that surround a rising or falling trend, and what the shape and angle of each channel can tell us regarding the price range. We will show how higher highs and higher lows define an uptrend and lower highs and lower lows define a downtrend.
Like simple trend lines and channels, moving averages (or MAs) are another kind of trend line that helps clarify the trend because they smooth out the gyrations of individual price or candle movements. We will examine the advantages of MA’s over simple trend lines and channels and their variations.
The final type of trend lines are Bollinger Bands. We show how these can combine the traits of both channels and simple moving averages (SMAs), giving us an indication of both S/R and momentum.
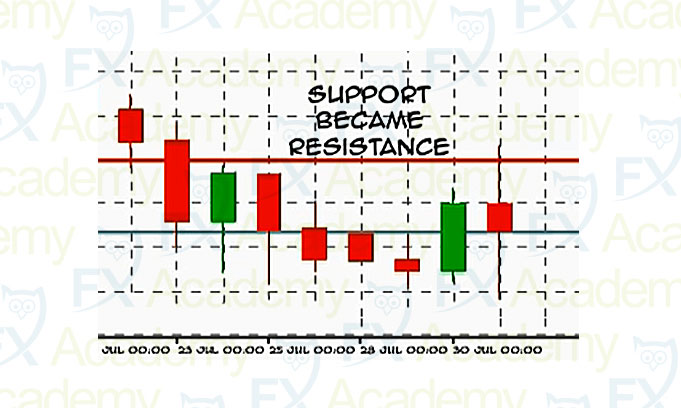
Support/resistance levels are not meant to be impenetrable barriers which will repel price, offering an easy buy at support or sell at resistance. Support/resistance levels are simply an identifications of the places on the chart which previously displayed a supply/demand imbalance, i.e. areas which remain emotionally in the mind of other traders or hold leftover orders from the original bounce. These levels are watched closely by traders for potential further influence on price movements.
In this lesson, we will learn how these price levels provide structure to our market, and define some of the higher probability spots where a trader should look for trade opportunities.
Start this Lesson ›
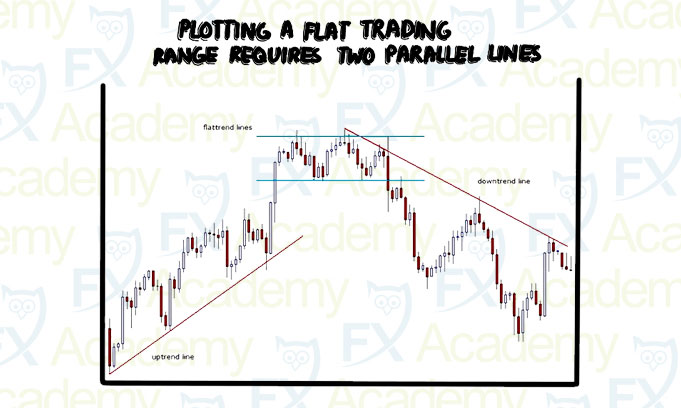
A single trend line is a Forex trend indicator. It is one of several support/resistance indicators that can be used in Forex trading. When plotted on a graph, single trend lines can show the Forex trader a line which has a probabalistic edge of being a line of bargain prices.
This lesson will explain single trend lines and how they can be used to help determine Forex trade entries and exits.

In this lesson we will learn about the use of Forex Channels as a support/resistance indicator. Forex price channels are parallel or semi-parallel trend lines that surround a rising or falling trend at an angle and width that captures the overall slope of the trend, like a single trend line. However, price channels over certain advantages over single trend lines. Trading channels in Forex can yield better results than trading single trend lines, especially when the channel trend lines are symmetrical.
Start this Lesson ›
In this lesson, we will talk about the use of Moving Averages (MAS) in Forex trading.
Like simple trend lines and price channels, moving averages can act as another type of trend line that helps clarify a price trend because they smooth out the gyrations of individual price or candle movements.
Moving average lines for a given period don’t plot the actual price at a given moment. Instead, each point on these lines is the average closing price of a certain number of prior candlesticks or periods.
As each new closing price is added, the oldest one is dropped from the calculation, hence the term “moving average”.

In this lesson we will introduce a new indicator called Bollinger Bands.
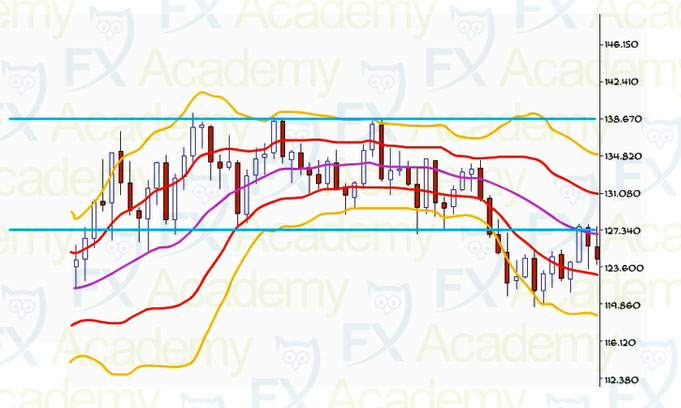
Bollinger Bands (BBs) are essentially a simple moving average (SMA) in the shape of a channel, defined by standard deviations either side of the moving average, rather than the usual single line. Bollinger Bands combine the traits of channels and SMAs, and can tell us about both S/R and momentum at the same time.
Bollinger Bands have several advantages over indicators and we will review some of them in this lesson.


We hope you found our site useful and we look forward to helping you again soon!