Market Snapshot Example 5
Picking Pairs & Strategies: Market Snapshot Example 5
Based on actual trading data from Sep 28, 2014. Using a variety of technical and fundamental analytical tools, we examine a range of major and minor currency pairs over the weekend, determining from a review of technical charts and forthcoming economic events where likely trade decision points are going to arise. Noting these points, our ongoing analysis determines which strategy should be best used in each particular case to take advantage of any trade opportunity.

Market Snapshot Example 5
Subjects Covered:
- Signal Candles
- Time of Day
- Position of Support/Resistance
- News Impact
Weekend Review 1
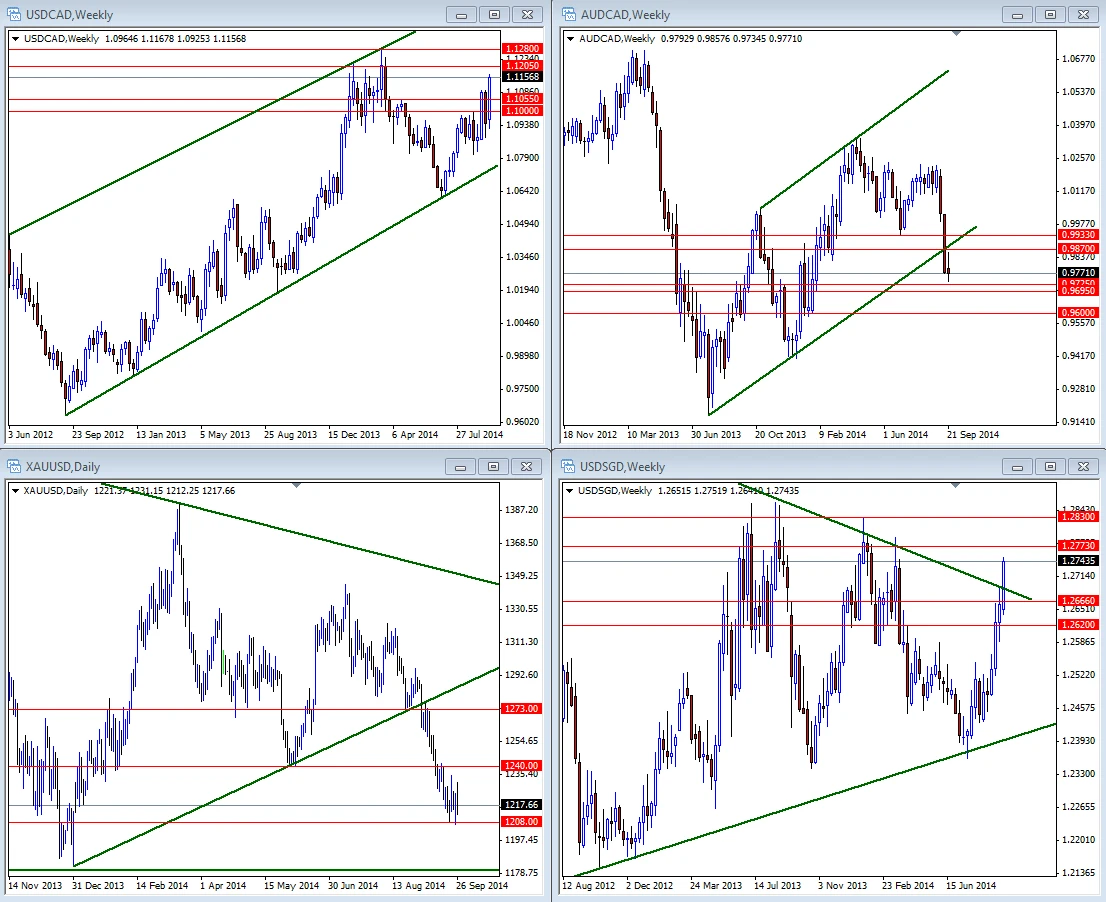
At the end of each week, I have a look at weekly and daily charts to get a feel for the potential market direction. Although some traders do focus solely on shorter-term time frames (such as M30, M15 or M5), they could still get some benefit from looking at significant longer-term patterns and formations.
This week, we have 3 currency pairs and gold to analyze and decide what to do (or what not to do).
Weekly News Calendar
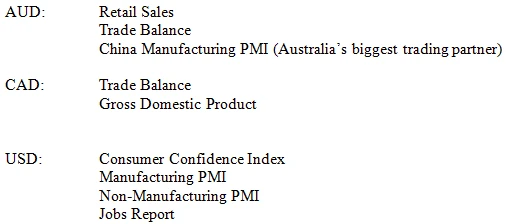
The next thing I do is to check the weekly economic calendar and find out if there are any high impact report releases which might affect the pairs I picked. Next let’s inspect the charts closely.
USD/CAD
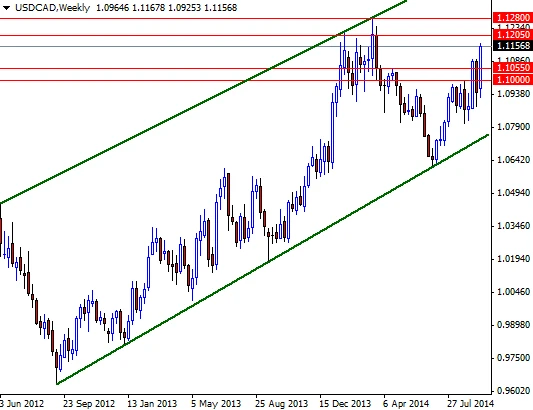
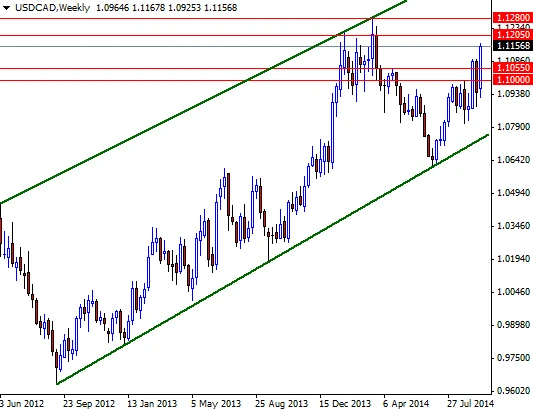
After a temporary pause, the USD/CAD pair continued to move higher. It seems like the American dollar continues to be the currency everyone wants to own, but we should keep in mind that the Canadian dollar is usually sensitive to oil markets.
Options:
– Open a short position…it can’t rise forever!
– Open a long position if prices pull back to the 1.1055 level (or should we wait for 1.1000 to print on the chart?)
– Keep an eye on the 1.1000 – 1.1205 area and wait for a breakout.
AUD/CAD
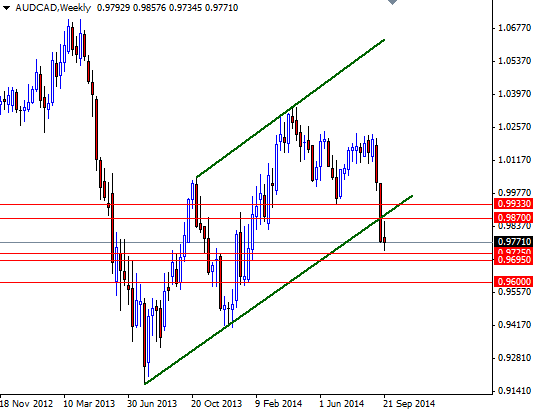
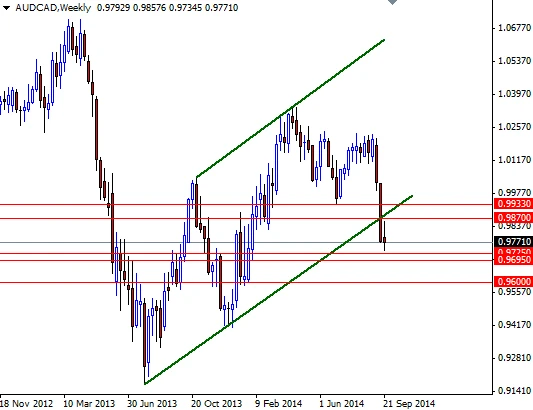
The AUD/CAD pair broke below the 0.9870 level (the bottom line of the channel) two weeks ago. Last week’s price action wasn’t so surprising because when a trend line is broken, the market usually responds and retests it. Could this be the beginning of a much more serious sell off?
Options:
– Go long targeting the 0.9933 level.
– Open a short position if the pair hits the 0.9870 level.
– Wait for a break out (go long on a sustained break above 0.9870 targeting the parity level, go short if the pair closes below 0.9725).
Gold
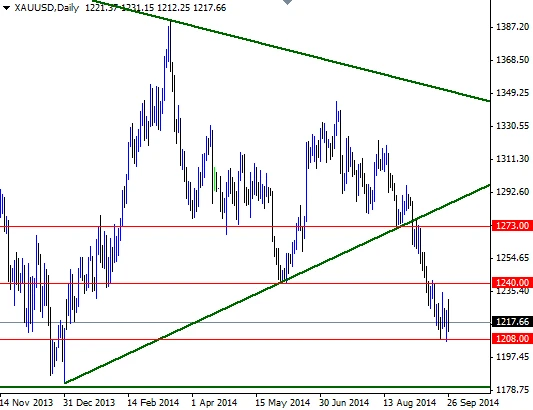
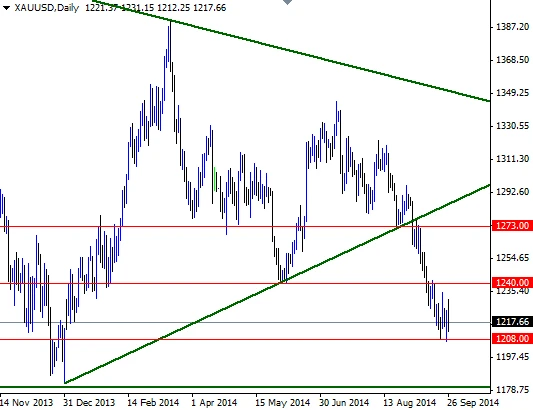
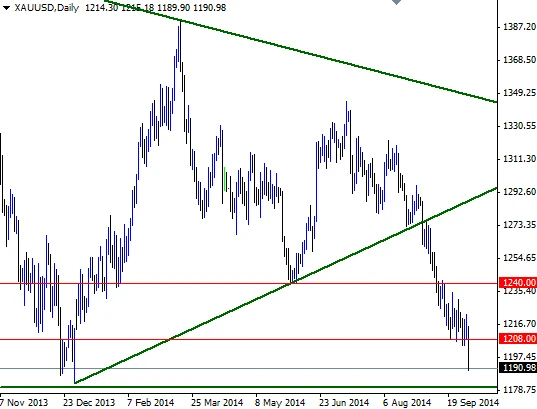
Despite Friday’s bearish price action, Gold ended the week slightly higher. The market has traveled quite a distance since the 1293 level became a strong resistance (as you can see on the chart, the market tested the broken trend-line before heading lower). As a result, gold found some support around the 1208 level recently.
Options:
– I don’t want to get involved until the market leaves the 1240 – 1208 consolidation area.
– Sell gold if the market drops below the 1208 level…or buy once we are above the 1232 level.
– I lost faith in gold…It is a matter of time before we see the 2013 low of $1180 is tested.
USD/SGD
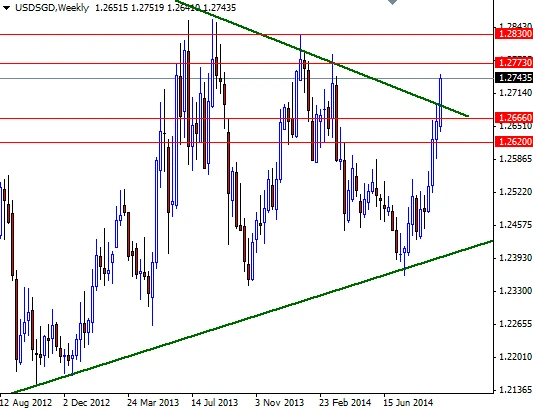
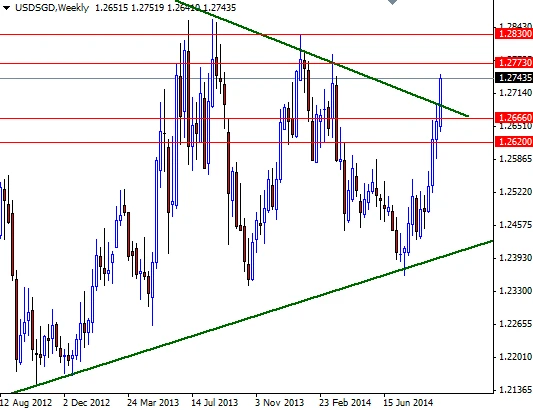
The USD/SGD pair has been climbing steadily since the pair bottomed out around the 1.2350 support level and last week the market managed to break above the top of the triangle we see on the weekly chart. Do you think this development will have a huge impact on this currency pair?
Options:
– Go long targeting 1.2990!
– Go short at 1.2830…this pair is overbought!
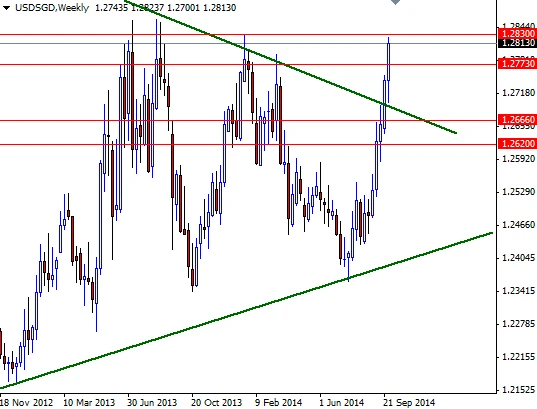
– Wait for a pullback, buy at 1.2710.
Weekend Review 2
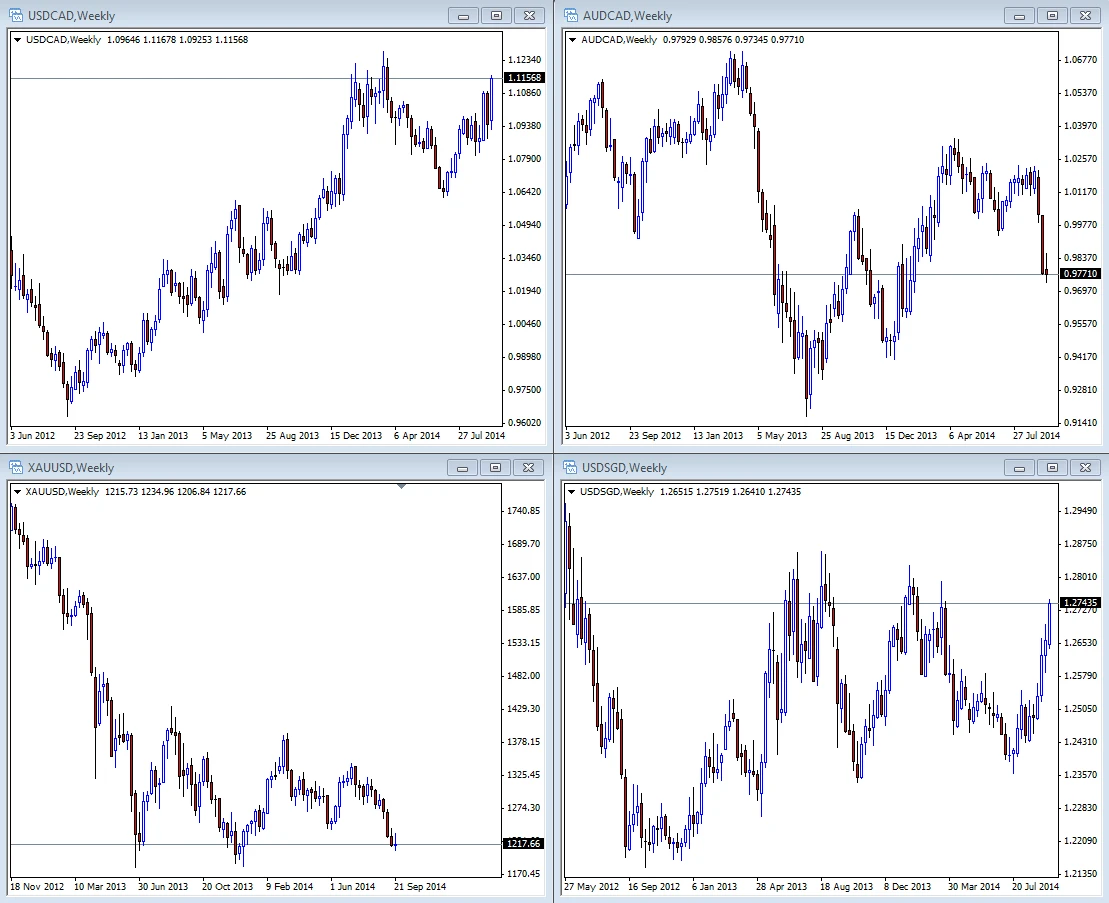
Last week, we picked 4 new instruments and applied some technical analysis methods to decide what to do (deciding what not to do is as important as what to do, if you want to be a successful trader). Today, we are going to see the results.
USD/CAD 2
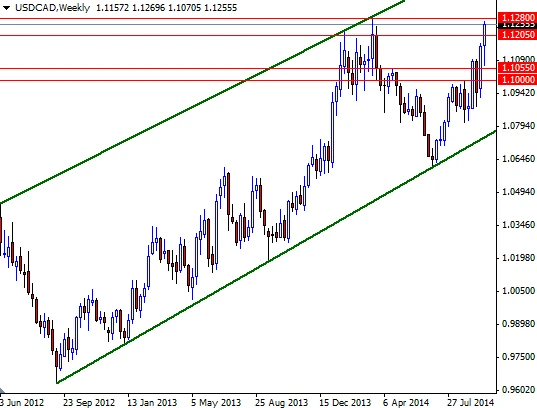
When I look at this pair, two things come to my mind first: First, the trend is your friend (of course until it ends) and next, don’t try to stop a speeding locomotive. The USD/CAD pair has been in a very strong uptrend and as we noted last week, there was nothing to suggest this outlook would change anytime soon.
USD/CAD 3
Keep in mind that it is impossible to catch every wave. Instead of catching the counter waves, you might want to try using shorter term charts to open positions following the trend. As you can see from this week’s chart, this was the best option.
AUD/CAD 2
Last week, we decided that the trend was very negative since the market broke below the 0.9870 support level which was also the bottom of the ascending channel.
AUD/CAD 3
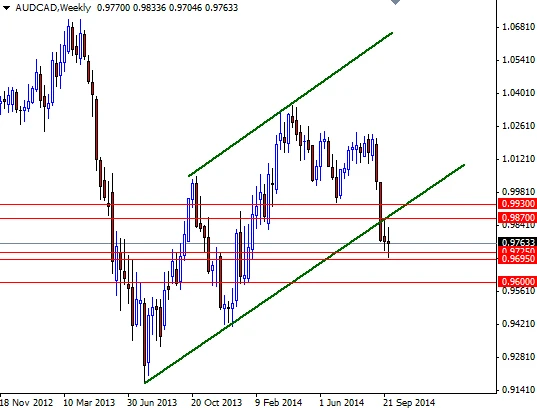
Now let’s see what happened. The AUD/CAD initially tried to reach the 0.9870 level but ended the week lower. It seems like our best option was to sell at higher prices. However, there is one more thing we should discuss here: profit targets. As you can see, the area between the 0.9725 and 0.9695 levels acted as both strong support and resistance in the past. In such cases, you may consider partial profit taking and adjusting your stop-loss to the entry point. If a bearish breakout occurs, you can add to your position.
Gold 2
If you think that price movements in the gold market don’t make any sense, you shouldn’t feel bad. A little more than a year ago Ben Bernanke said “Nobody really understands gold prices and I don’t pretend to understand them, either”. Remember, even though gold is a commodity, you can consider it as a Forex pair because Gold is also a currency.
Gold 3
The market went back and forth ahead of the closely watched non-farm payrolls report and closed the week lower on the back of better-than-expected numbers. Unless these market conditions (fundamentally and technically) change, there is no point in trying to find a bottom (or a top).
USD/SGD 2
The USD/SGD pair had an interesting situation as we broke out of a triangle originating in 2011 and we were wondering whether this might bring more buying pressure. Did the pair end the week higher?
USD/SGD 3
ot surprisingly the market headed towards the broken trend-line and found enough support to end the week higher. If you waited for a pullback and longed at 1.2710, you were the winner.
*This week please keep an eye on the XAU/USD and USD/SGD pair as both of them are approaching significant support/resistance levels. Do you think these historical levels will be able to reverse the current trends?
