Complete this quiz and
proceed to the next lesson
Start Quiz

Support/resistance levels are not meant to be impenetrable barriers which will repel price, offering an easy buy at support or sell at resistance. Support/resistance levels are simply an identifications of the places on the chart which previously displayed a supply/demand imbalance, i.e. areas which remain emotionally in the mind of other traders or hold leftover orders from the original bounce. These levels are watched closely by traders for potential further influence on price movements.
In this lesson, we will learn how these price levels provide structure to our market, and define some of the higher probability spots where a trader should look for trade opportunities.
I've mastered this topic, take me to the next lesson
We strongly recommend you open a free trading account for practice purposes.
One of the underlying tenets of technical analysis is that historical price levels predict future price levels. Since Forex is a 24-hour market, there tends to be a large amount of data that can be used to gauge future price activity, thereby increasing the statistical significance of the forecast. This makes it the perfect market for traders that use technical tools, such as trends, charts and indicators to analyze price levels.
Many traders turn to Forex technical analysis because it presumes that all the factors that influence a price - economic, political, social and psychological - have already been factored into the current exchange rate by the market. Technical traders use many different indicators in combination with support/resistance to aid them in predicting the future direction of exchange rates: Bollinger Bands®, Fibonacci retracement, moving averages, moving average convergence divergence (MACD) and stochastics. These technical tools are used in conjunction with other indicators and chart patterns.
This lesson’s video aims to explain:
The early reference to RAMM (risk and money management) deserves elaboration. Risk refers to how traders can limit risk, by using stop losses on every trade so the amount lost will usually either not exceed a defined amount, or exceed it by very little in cases of slippage. Money management refers to how much money as a proportion of their capital account a trader will risk on a particular trade, and is a topic in itself that will be covered later in the FX Academy syllabus.
Now you understand some basics about candle charts, (S/R) and other indicators. You’re ready to get to the meat of Technical Analysis and learn the tools to identify the likely support area at which to enter or open a position and the likely resistance zone at which to exit or close it.
A price level is where a trend tends to start, pause, or reverse. It is the most basic kind of support and resistance level and perhaps the most intuitively obvious.
A quick look at the chart below will reveal which price levels are S/R points.
You will notice that often, some of the best support and resistance bands occur at the highs and lows of days, weeks, and monthly time periods. You can mark these easily, as the levels speak for themselves. Where you see a band that has acted as a high and/or low for several days, weeks, and months, you can expect that such a band will be likely to act as strong S/R:
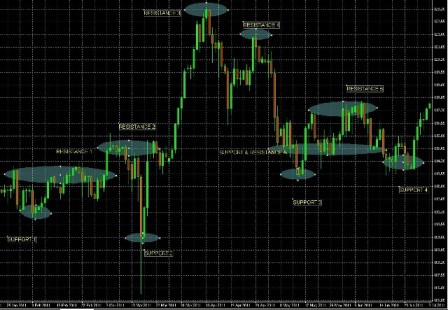
We need to remember, that just like with all other kinds of S/R points:
Price levels are narrow price bands or ranges rather than specific prices.
Once broken, resistance may become support as markets remember the former resistance as a relative bargain. Support that becomes resistance and vice versa typically acts as reliable and strong S/R. Similarly, once a support level is broken, markets will view it as a maximum or full price until something happens to convince markets that the currency pair is once again worth more than that.
The more IRATE a price level, the stronger it is: Irate stands for:
Indicators: the more that converge on a given price range the stronger S/R it becomes
Round Number: The more zeros at the end the more respect it tends to get. What is confluence in trading? When you get indicators, trend lines, and round numbers all happening at the same time in the same area of price, this is called "confluence" i - and it can act as very powerful, high-probability support or resistance.
Age: The longer the price area has held as S/R the stronger it is
Tested: The more times the price area has been tested, the stronger the S/R there. However, sometimes when it is tested more than two or three times, it starts to weaken.
Let’s use the example in the chart below:
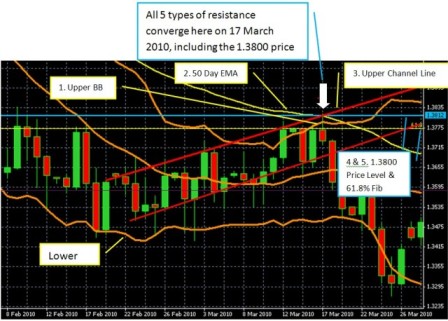
Note how the 1.3800 price level was very strong resistance because it was reinforced by 5 different kinds of S/R indicators. You don’t have to know about these indicators, just understand that there were 5 different kinds of technical resistance indicators (numbered 1-5) in this chart.
The chart below shows a long-term perspective. Support and resistance levels that can be identified from IRATE criteria on longer term charts are usually stronger than S/R identified from shorter term charts.
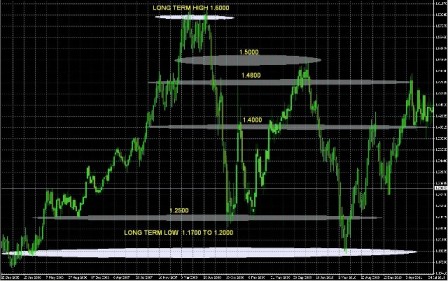
For example, the long term low zone between 1.17 and 1.20 shown on this chart was established over several years, meaning it is older and has held for longer than, say, last week’s high price.
Follow us on:
![]()
![]()
![]()

We hope you found our site useful and we look forward to helping you again soon!
