Complete this quiz and
proceed to the next lesson
Start Quiz

In this lesson we will introduce a new indicator called Bollinger Bands.
Bollinger Bands (BBs) are essentially a simple moving average (SMA) in the shape of a channel, defined by standard deviations either side of the moving average, rather than the usual single line. Bollinger Bands combine the traits of channels and SMAs, and can tell us about both S/R and momentum at the same time.
Bollinger Bands have several advantages over indicators and we will review some of them in this lesson.
I've completed all lessons on this course, take me to the course syllabus page
We strongly recommend you open a free trading account for practice purposes.
Bollinger Bands are used to measure a market's volatility. This little tool tells us whether the market is quiet or whether the market is active. When the market is quiet, the bands contract and when the market is moving full steam ahead the bands expand.
One thing you should know about the Bollinger Bands strategy is that price tends to return to the middle of the bands.
Here are two Bolling Band strategies to consider: the Bollinger bounce occurs because Bollinger bands act like dynamic support and resistance levels. The longer the time frame you are in, the stronger these bands tend to be.
With the Bollinger squeeze the bands start to squeeze together which usually means that a breakout is getting ready to happen. On a graph, when the candles start to break out above the top band, then the move will usually continue to go up. If the candles start to break out below the lower band, then price will usually continue to go down.
Bollinger Bands (BBs) are essentially an SMA in the shape of a channel rather than a single line. Because they combine the traits of both channels and simple moving averages (SMAs), they tell us about both S/R and momentum. We’ll focus here on their use as S/R.
Typical Bollinger Bands are built by plotting a 20 period SMA (purple), then plotting a band of specified units of standard deviation (a statistical measure of deviation) around that SMA thus forming a kind of channel.
See the chart below:

The default settings of BBs are usually “20,2.”
You can tinker with them as you like, and later we’ll discuss one very useful variation when we introduce ways to use BBs as momentum indicators.
There are several advantages of Bollinger Bands over channels:
Bollinger Bands are better for anticipating the crowd’s moves: Like MAs, they’re plotted by an objective calculation, so everyone viewing Bollinger Bands with the same settings is seeing the exact same S/R from those Bollinger Bands. That’s one reason why it’s worth watching Bollinger Bands with these standard settings because they’re so widely used and thus tell us what the herd is seeing as potential S/R, and entry/exit points, when they view Bollinger Bands.
Bollinger Bands tells us about momentum: The width of the Bollinger Bands channels tracks price volatility. In other words, when price is making a series of big moves, the width of the Bollinger Bands channels widens. When price movements are small, the channel narrows. That means that when price is continually testing either one of the upper or lower bands or breaks past one of them, momentum is very strong. This brings us to an important limitation of Bollinger Bands as S/R: Bollinger band strategy is a meaningful S/R only in range-bound markets.
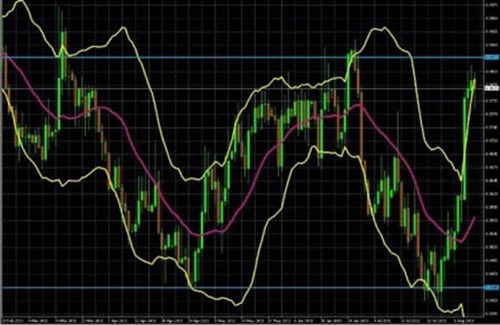
Note in the above chart how often the Bollinger Bands serve as S/R points. Part of the reason is that the two standard deviation distances from the central SMA, meaning a 4 standard deviation wide channel, are wide enough to ensure that there’s a 95% chance of prices staying within it, based on the number of prior periods covered by the SMA that’s located in the center of the channel.
As noted above, Bollinger Bands stretch like rubber bands to contain most price movements. That’s because Bollinger Bands:
That means the statistical probability at any moment of the price touching or breaching the bands is only about 5%. However, like any statistical measure, it assumes that all elements of the sample, in this case the prices in the 20 periods, are equally probable.
That assumption works for flat, range-bound markets or gently trending markets, which by definition are periods during which the markets’ perception of a currency pair’s value remains unchanged. Under these conditions, the price tends to fluctuate between the upper and lower bands, as it bounces off the upper and lower bands like a ball bouncing between the floor and ceiling, as shown in the chart above.
That’s a classic range bound chart, as highlighted by the horizontal blue channel lines. Notice how, despite all the gyrations, price is essentially unchanged over the period the chart covers.
However, this assumption doesn’t apply during a strong trend, which by definition indicates that market perceptions about value are changing quickly. The prices of the prior 20 periods are NOT equally probable. Indeed, much higher or lower prices suddenly become far more likely. Like any other moving average, Bollinger Bands, which are just an SMA in the shape of a channel, lag behind price, and the gap widens when trends are strong.
Let’s look at an example. Note in the chart below how price continued to climb along the upper band from April to mid-June 2010, September to October 2010, February to April 2011, and July 2011 (all periods highlighted).
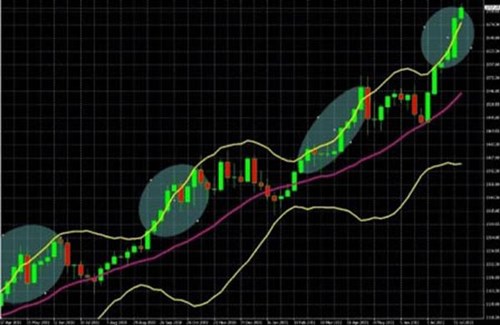
In other words, the Bollinger Bands often didn’t provide useful resistance for the strong up trend as price repeatedly climbed up the outer bands for extended periods.
Later, we will present a Bollinger Bands strategy.
Follow us on:
![]()
![]()
![]()

We hope you found our site useful and we look forward to helping you again soon!
